00412 da2f3edbd57c949b266970c57440aea
416
Pignatiello & Ramberg
X
X
-1-1-1-1-H
-2.4 -1.2 0.0 12 2.4
Normol Score
N=1000 observolions
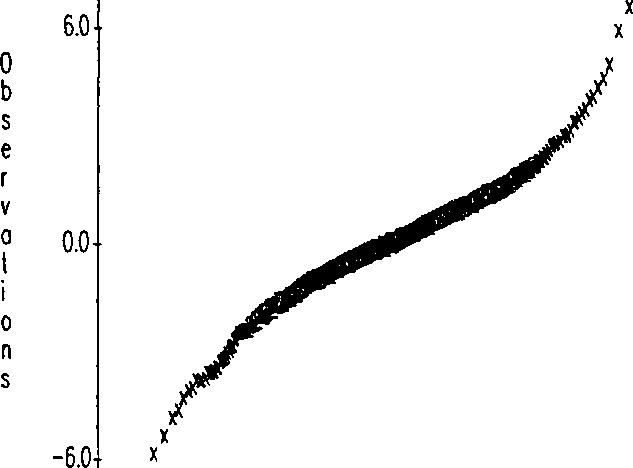
Figurę 2. Normal Probability Plot from Studenfs t Distribution.
Wyszukiwarka
Podobne podstrony:
00404 ?42ec37fc4cd13c2480fd62b55231c6 408 Pignatiello & Ramberg by a single niunber. In situati
00408 ?6a11bfc2009d0e6e5a47d30c46a1f3 412 Pignatiello & Ramberg _ T-LSL . _ = —-- and C pti 3ct
00410 ?6ab4d74bfed7fa1bc1d2983d77179c 414 Pignatiello & Ramberg determine confidence intervals.
00414 ?8e21de209c04940824ad6ecd537067 418 Pignatiello & Ramberg -2.0 -1.0 0.0 1.0 2.0 Nor mai S
00418 ?56a13f3cdc41e5c794440043a03715 422 Pignatiello & Ramberg2 N = 1000 Mid
00420 ?2f668bae8c68b95c1428301c9869d1 424 Width of 90% Confidence Interval Pignatiello & Ramber
00424 ?4589320c2ec691373ff85747154741 428 Pignatiello & Ramberg the process is in-control or is
00426 190c45644d0b0a239e28db52d020e7 430 Pignatiello & Ramberg Thus, we have three different ‘
00428 R6477e3a6b2ece2e9df3395dc73b468 432 Pignatiello & Ramberg wise to follow it with a formal
00422 Kd9d19b15fc678a197c7290d30e0b4a 426 Pignatiello & Ramberg A “process capability study ” i
więcej podobnych podstron