3582517636
File Edit Codę View Plots Session Build Debug Profile Tools Help
U#
O • Ot H lii _ Ą OotC*:«-*.f>CtO' - AOCrj •
MlMpriM ° SatyDK* TOR* —• Hurt ** **Jojrc*
iH Sc^<« or Sr.* / .
14 •• 4.Średni 4 z próby
15 r«in;x.ł*rp:
16
17 •• 5.średni na ceru konia 1« nean(horseprlceSPrlce)
19
20 M6.
21
22 x.bar <- nean(horsepr1ceSPr1ce, na.rm - troć)
23 x.bar <- sull
24 for(1 1n 1:50)
25- (
26 X.sanp <- sairpłeChorseprIceSPr 1ce,2S)
27 X.bar(1] <- »ean(x. sanp.i
28
29 )
30 * Porównajmy rozkład wzrostu cen ze średnia z prób
31 par(«frow-c(1.2))
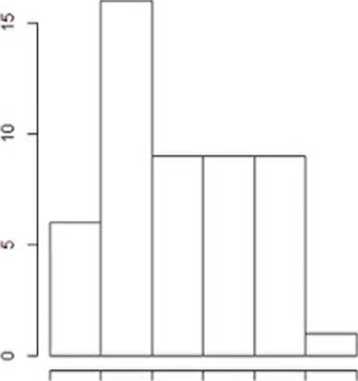
32 h1st(x.bar, ma1rv."sredn1a z próby")
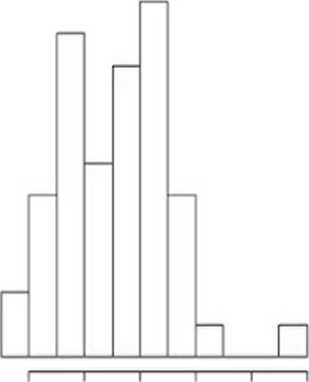
33 h1st(horseprlceSPHce, nain-"wzrost cen”)
35 •• 7.odejmu1emy średnią w cenach koni od każde) średniej z wylosowanych' Pr0b 1 SPrłw<J**n,>' ci> P
36 nean(abs(x. bar mean(horseprlceJPrlce)) <- 1)
37
38 •» 8.wartości graniczne w próbie : 10* 1 90*
39 quant11e(x.bar, c(0.1, 0.9))
40
41 | 9. przybliżenie rozkładen r:riralnyr
42 qnor*(«0.1, 0.9), mean x.bar , sd(X.bar»
43
44 •• 10.odchylenie standardowe
45 s - sd(horseor1ce$Pr1ce. na.rm - truć)
41:1 (%OUve6: L.j-.v-
□
Contoto IttmtnM
W^WD^Io*./
> x.bar <- sull
> for(1 1n 1:50)
♦ {
♦ x.samp <- saap1e(horsepr1ceSPr1ce,25)
♦ x.bar[1] <- mean(x.sanp)
♦
♦ )
> • Porównajmy rozkład wzrostu cen ze średnia z prób
> par(«fro«-c(1.2))
> h1st(x.bar, ma1n-~sredn1a z próby")
> h1st(horsepr1ceSPr1ce. na1n-"wzrost cen")
> •• 7.odejmujemy średnią w cenach kom od ka2dej średniej z wylosowanych prób 1 sprawdzany czy me przekracza 1
> nean(abs(x.bar - mean(horseprlceSPrlce)) <• 1)
[1] 0
> •• 8.wartości graniczne w próbie : 10* 1 90*
> quant11e(x.bar. c(0.1, 0.9))
10* 90* T
24908.0 29277.6 1
> •• 9.przybił Zenie rozkładem normalnym
> qnorm(c(0.1. 0.9), «ean(x.bar). sd(X.bar))
(1) 24766.44 29556.92
>
|
l5«M &vr»fr>r*t ■ | |
|
Data | |
|
O horseprice |
50 obs. of 6 variables |
|
values | |
|
1 |
50L |
|
x.bar |
26840 |
|
X. bar |
nua [1:50] 25544 25656 26444 24836 28104 ... |
|
x.samp |
int [1:25] 4500 1100 30000 45000 15000 2SOOO 2000 12000 20000 38000 |
frtei Plótł PackłflOł help Vie««
i* Zoorr ? l«0<t • O /
■5r •
co

o
5
8
24000 28000 32000
0 10000 30000 50000
Xbar
horsepnceSPnce
Wyszukiwarka
Podobne podstrony:
) ~/Arbeiten an der TU/RstudioJutońal/Tutorial - RStudio __ ^ File Edit Codę Vies» Plots Session Bui
File Edit Codę View Project Workspace Plots Tools Help 0 @ e ( * Go to file/function (J
Kfigs11 m icrosoft Developer Studio - ShowStringB00 File Edit Vi View insert Project Build Layout Jo
to File Edit Search View Refactor Project Run Component lools Window Help O 2 fault Layout-1 fi ą O.
ConsoleApplicationl - SharpDevelop File Edit View Refactor Project Build Debug Search Ąnalysis Tools
* Taxation - Microsoft Visual Studio File Edit View Project Build Debug Team Tools Architecture Test
HelloWorld - Microsoft Visual Studio File Edit View Project Build Debug Team Tools Test Analyze Wind
* DataBaseFunctionalTests - Microsoft Visual Studio File Edit View Project Build Debug Team Tools Ar
Help * DataBaseFunctionalTests - Microsoft Visual Studio File Edit View Project Build Debug Team Too
* DatabaseFunctionalTests - Microsoft Visual Studio File Edit View Project Build Debug Team Tools Ar
File Edit View Project Build Debug Team Tools Architecture Test Analyze $3 - 1 lii J1 -
SWS12 MVC - Microsoft Visual Studio File Edit View Refactor Project Build Debug Team Data Tools Aręh
Analysis Services Projectl - Microsoft Visual Studio File Edit View Project Build Debug Database Too
po lab6 1x 2 ex scr1 File Edit View Project Build Debug Format Tools Test Window Help j
po lab6 1x 2 ex scr2 po-lab6.1x - Microsoft Visual Studio i _ File Edit View Project Build Debug For
File O Database - Microsoft Visual Studio Edit View Project Build Debug Team Tools Test Analyze Debu
więcej podobnych podstron